
The Sun
Minutes-old pictures from NASA's Solar Dynamics Observatory, a replay of any day, and what the Sun has been doing.
The Sun now
As NASA's Solar Dynamics Observatory photographed it.
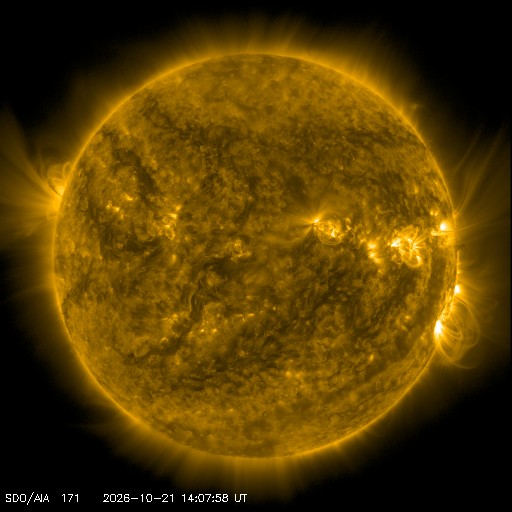
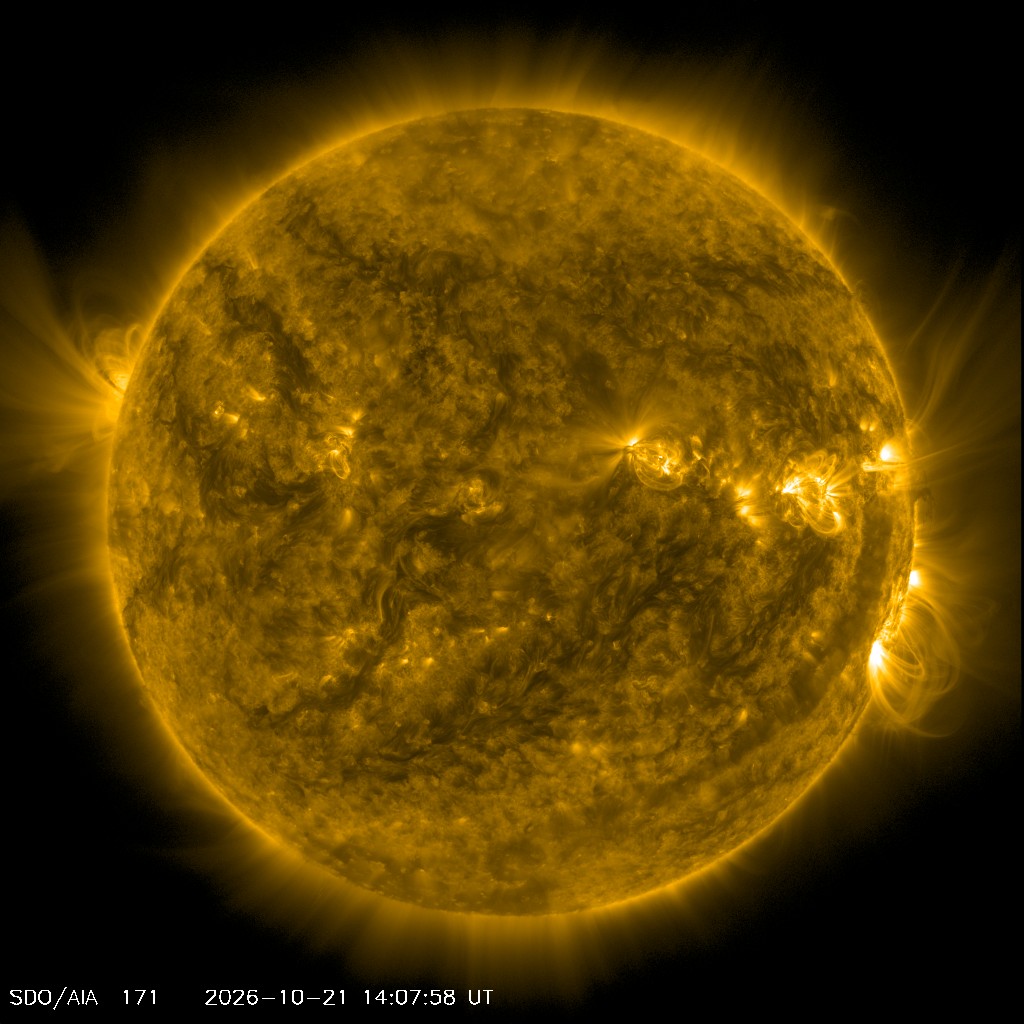
AIA 171 Å21 Oct 14:07 UTC16 min ago
Reading the day's pictures…
What AIA 171 Å shows
Quiet corona, upper transition region
: the light of Fe IX, at a typical temperature of about 630,000 K.
From NASA's channel table (log T 5.8; the kelvin figure is Browse's conversion). AIA images the Sun in seven extreme ultraviolet and three ultraviolet and visible channels; SDO prints each in a colour of its own, so a colour names a channel, not what an eye would see.
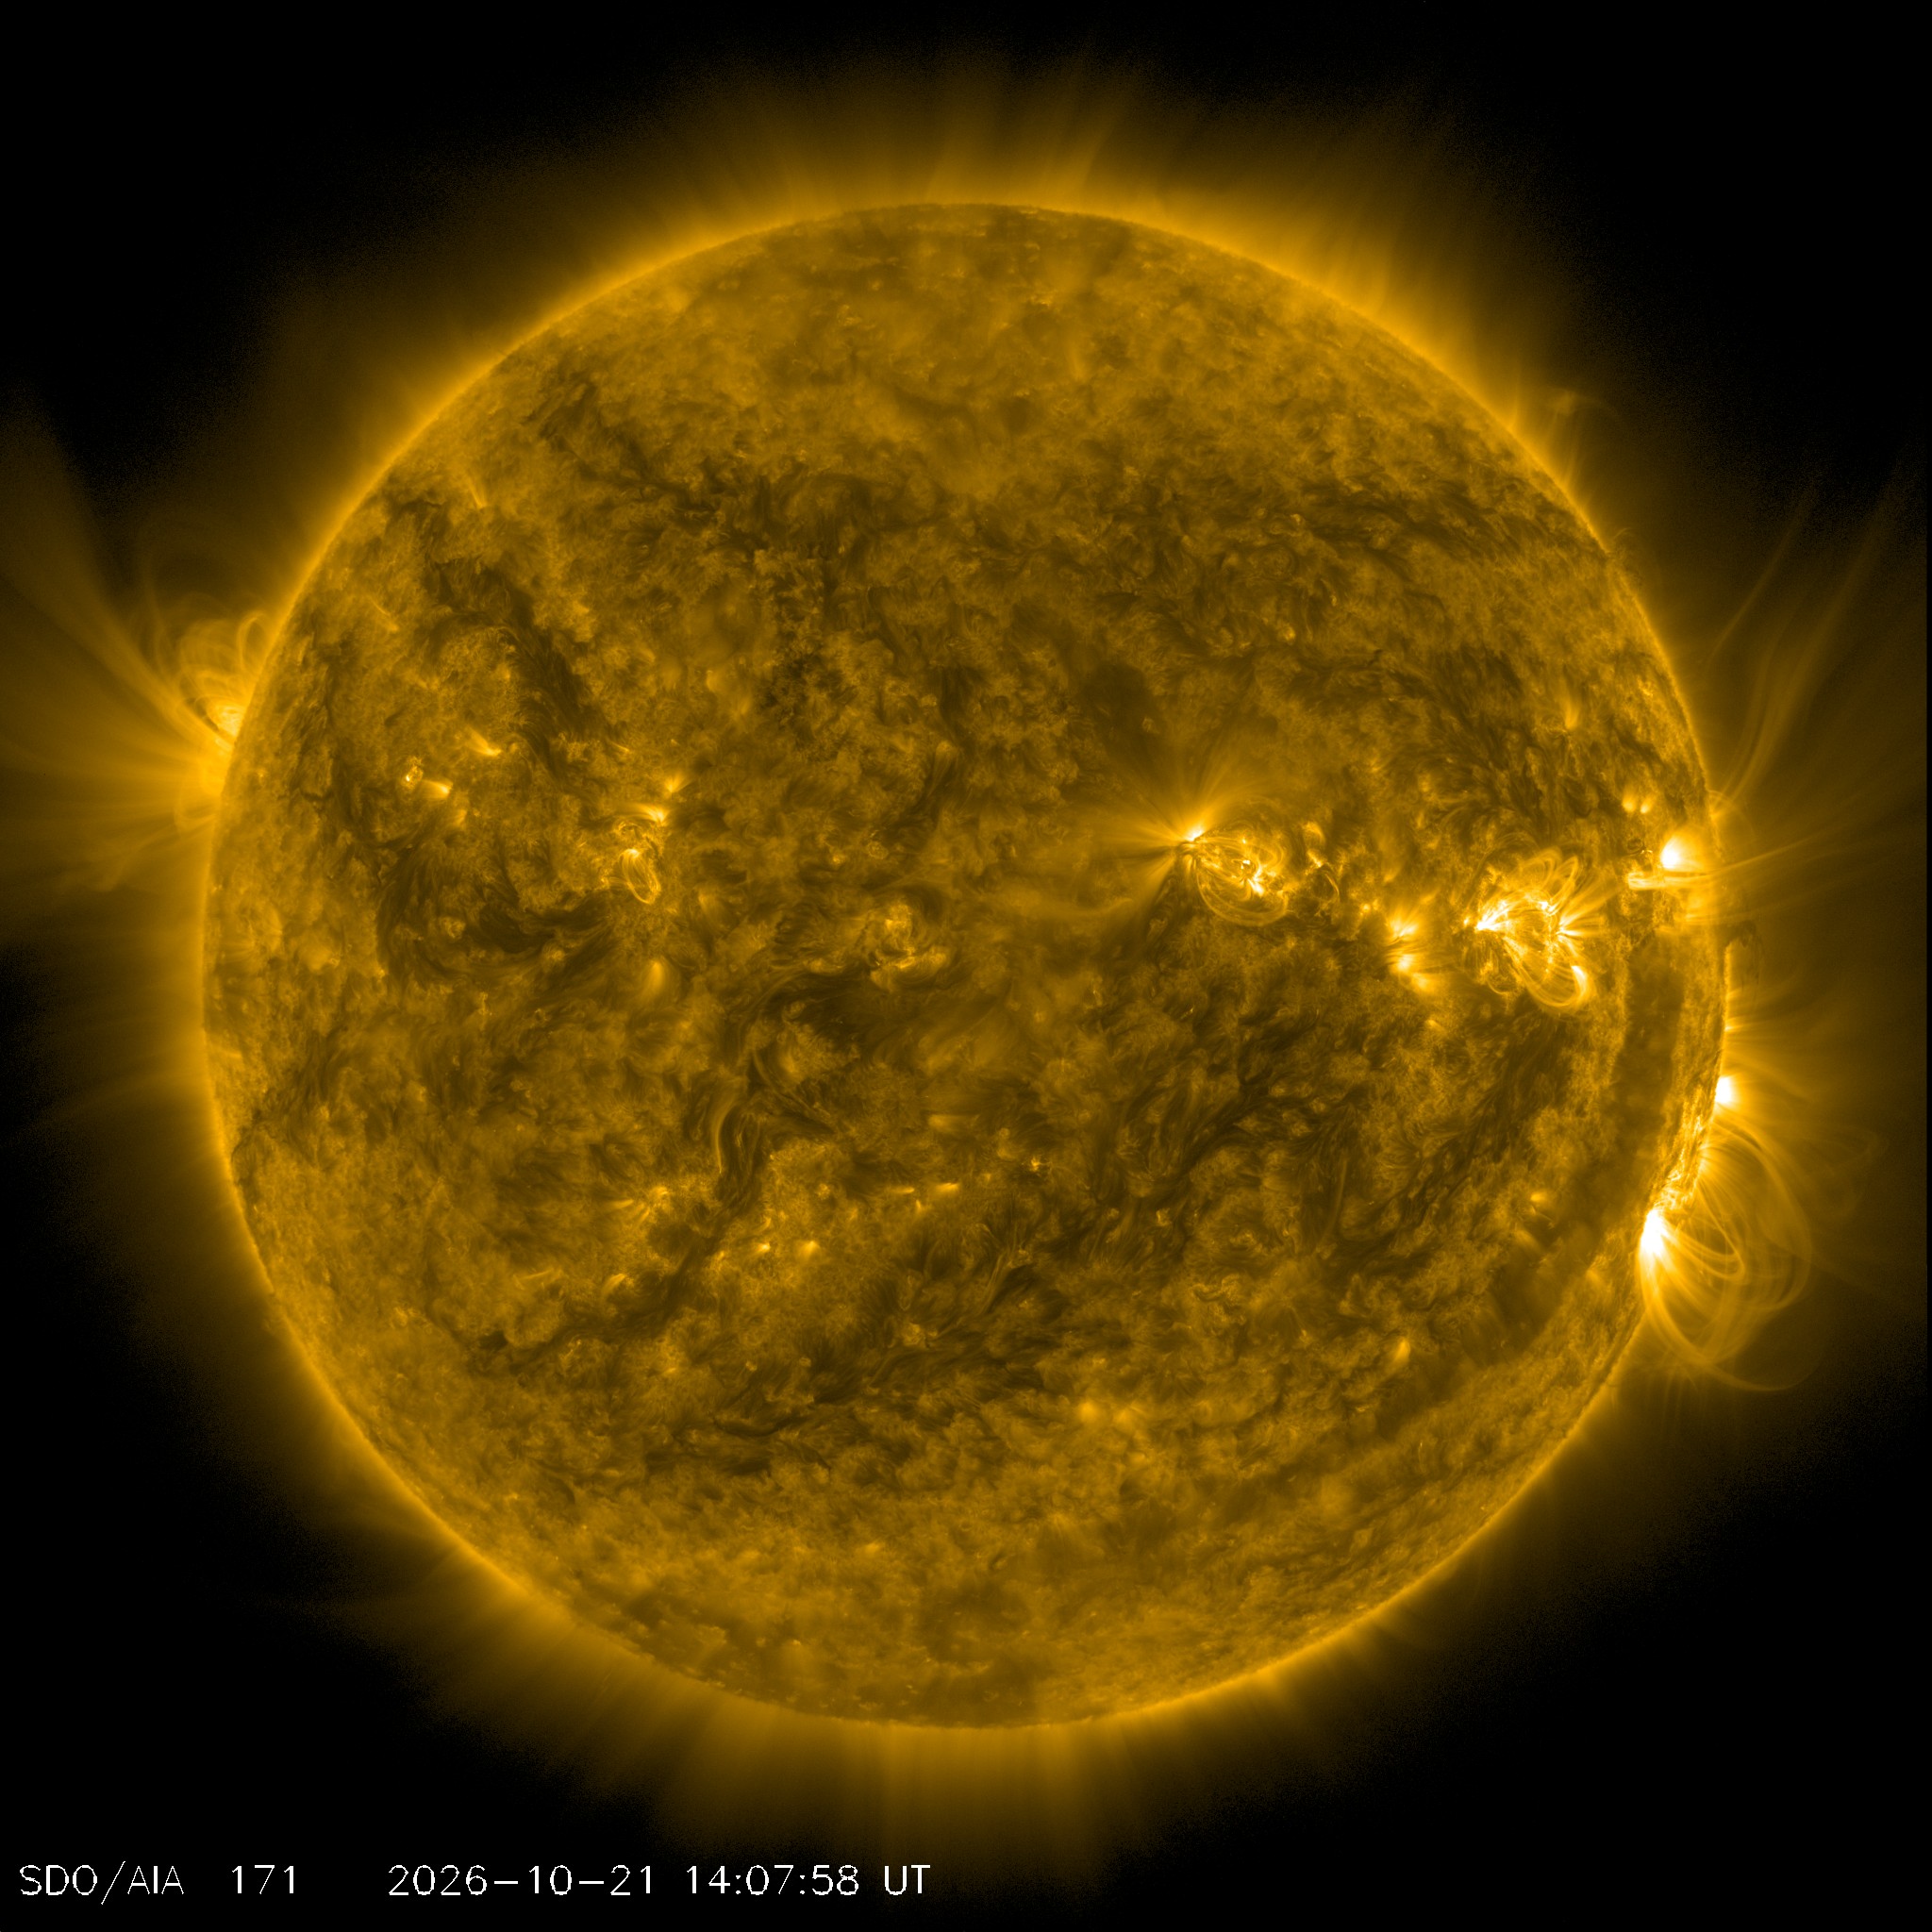
Courtesy of NASA/SDO and the AIA, EVE, and HMI science teams. The picture's time is in its file name; Browse last read SDO's list just now. SDO says its browse pictures are not for science analysis.
What the Sun has been doing
The last 30 days, as NASA's DONKI records them. Open any flare or eruption to see it in the pictures above.
Flares OBSERVED
- M1.6Peak 19 Oct 09:03 UTCS15W48 · region 14551↗
- M1.3Peak 16 Oct 15:42 UTCS16W15 · region 14551↗
- M6.4Peak 10 Oct 15:10 UTCN08W54 · region 14549 · with a CME↗
- M1.2Peak 10 Oct 14:12 UTCN08W51 · region 14549↗
- M1.3Peak 9 Oct 14:09 UTCN15W90 · region 14547 · with a CME↗
- M6.7Peak 8 Oct 15:48 UTCN12W20 · region 14549 · with a CME↗
- C7.9Peak 7 Oct 13:17 UTCN10W04 · region 14549↗
- M1.8Peak 6 Oct 08:05 UTCN08E07 · region 14549 · with a CME↗
- M1.4Peak 6 Oct 06:10 UTCN10E12 · region 14549 · with a CME↗
- M1.0Peak 5 Oct 18:48 UTCN20E10 · region 14545↗
- B9.3Peak 4 Oct 06:30 UTCS19W62 · region 14546 · with a CME↗
- B3.2Peak 4 Oct 06:19 UTCS20W62 · region 14546 · with a CME↗
GOES X-ray classes run B, C, M, X, each ten times the one before. See it opens the moment in 131 Å, the channel NASA lists for flaring regions.
Coronal mass ejections OBSERVED
- CMEFirst seen 20 Oct 14:23 UTC920 km/s, class C ESTIMATE↗
- CMEFirst seen 20 Oct 09:09 UTC568 km/s, class C ESTIMATE↗
- CMEFirst seen 20 Oct 07:24 UTC748 km/s, class C ESTIMATE↗
- CMEFirst seen 18 Oct 23:15 UTC590 km/s, class C ESTIMATE↗
- CMEFirst seen 17 Oct 02:48 UTC1,048 km/s, class O ESTIMATE↗
- CMEFirst seen 16 Oct 20:24 UTC552 km/s, class C ESTIMATE↗
- CMEFirst seen 16 Oct 12:38 UTC247 km/s, class S ESTIMATEWas modelled to reach Earth 20 Oct 18:00 UTC (a glancing blow), WSA-ENLIL run of 16 Oct 17:39 UTC FORECASTDONKI links it to a shock at 20 Oct 11:23 UTC↗
- CMEFirst seen 12 Oct 05:09 UTC741 km/s, class C ESTIMATEWas modelled to reach Earth 14 Oct 09:04 UTC, WSA-ENLIL run of 12 Oct 13:31 UTC FORECASTDONKI links it to a shock at 14 Oct 17:28 UTC↗
33 of 98 CMEs DONKI records in these 30 days, listed when DONKI's analysts class it C or faster (500 km/s and up) or a WSA-ENLIL run gives it an arrival at Earth. Speeds are DONKI analysts' measurements; an arrival is a model run's. See it opens the corona at the time the CME was first seen.
What DONKI's analysts sent out
- Space Weather Notification - CME (BepiColombo, Parker Solar Probe, OSIRIS-APEX)
- Space Weather Notification - Radiation Belt Enhancement
- Auto-generated Space Weather Notification - Radiation Belt Enhancement
- Weekly Space Weather Summary Report for October 07, 2026 - October 13, 2026
- Space Weather Notification - Interplanetary Shock
- Space Weather Notification - CME update (ensemble) (Missions Near Earth)
NASA CCMC and the Moon to Mars Space Weather Analysis Office, DONKI, read just now. CCMC says DONKI's real-time information and simulations "should be considered only as prototyping quality and in research context"; NOAA's Space Weather Prediction Center is the US government's official source of space weather forecasts.
Explore further, in NASA's own tools
Each opens on its maker's site.
- NASA's Eyes on the Solar System ↗NASA/JPL's 3D simulation, from mission data; not a camera.
- Helioviewer ↗Layers from many solar telescopes, screenshots and movies of any date.
- SDO: The Sun Now ↗Every SDO channel and composite, and SDO's daily movies.
- NOAA Space Weather Prediction Center ↗The US government's official space weather forecasts and alerts.